
When we talk about “safest areas,” the key metrics are:
- Crime rate per 1,000 residents
- Relative trend (is crime going up or down)
- Type of crime (violent, theft, burglary)
- Local infrastructure, policing, community factors
London’s safest boroughs & neighbourhoods in 2025
Below are some of the safest boroughs/neighbourhoods ranked in London as of 2025, noting advantages and caveats.
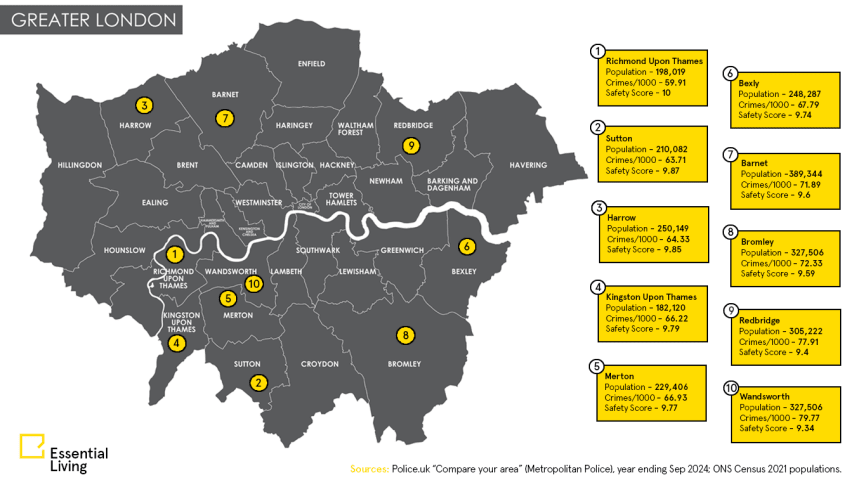
1) Richmond upon Thames
Safety rating: 10.00 | Population: 198,019 | Crime/1,000: 59.91
- Pros: Leafy, riverside, village feel; strong community; good schools.
- Cons: Some pockets have longer commutes; premium rents near parks/riverside.
2) Sutton
Safety rating: 9.87 | Population: 210,082 | Crime/1,000: 63.71
- Pros: Family-friendly, parks and schools; calm residential streets.
- Cons: Further from Zone 1; fewer late-night options
3) Harrow
Safety rating: 9.85 | Population: 250,149 | Crime/1,000: 64.33
- Pros: Leafy NW suburbs; community feel; Metropolitan line access.
- Cons: Quieter at night in some areas; longer intra-borough journeys.
4) Kingston upon Thames
Safety rating: 9.79 | Population: 182,120 | Crime/1,000: 66.22
- Pros: Calm riverside living; fast rail to central London; strong high street.
- Cons: Premium zones cost more; river-adjacent areas can be busy at weekends.
5) Merton
Safety rating: 9.77 | Population: 229,406 | Crime/1,000: 66.93
- Pros: Wimbledon/Raynes Park amenities; good transport; green spaces.
- Cons: High demand pushes rents; event days add footfall in Wimbledon.
6) Bexley
Safety rating: 9.74 | Population: 248,287 | Crime/1,000: 67.79
- Pros: Suburban feel; value for money; quieter streets.
- Cons: Limited nightlife; some longer commutes depending on station.
7) Barnet
Safety rating: 9.60 | Population: 389,344 | Crime/1,000: 71.89
- Pros: Large green borough; multiple Northern line branches; good schools.
- Cons: Spread-out—journey times within borough can be long.
8) Bromley
Safety rating: 9.59 | Population: 332,336 | Crime/1,000: 72.33
- Pros: One of the largest/greenest; strong rail from hubs like Bromley South.
- Cons: Car reliance in parts; longer trips across the borough.
9) Redbridge
Safety rating: 9.40 | Population: 305,222 | Crime/1,000: 77.91
- Pros: Elizabeth & Central line access; family-friendly pockets (e.g., Wanstead).
- Cons: Busier town centres (e.g., Ilford) can lift theft—check ward data.
10) Wandsworth
Safety rating: 9.34 | Population: 327,506 | Crime/1,000: 79.77
- Pros: Northern line + major rail interchanges; riverside paths; vibrant amenities.
- Cons: Hot spots command higher rents; mixed feel street-to-street.
Best practices when choosing a “safe” place in London
Even in the safest areas, London is a major metropolis. Here are tips to refine your choice:
| Factor | Why it matters | What to do |
|---|---|---|
| Transport & commute | A “safe” area is less helpful if your journey to work is dreadful | Look at actual commute time and reliability |
| Local policing / community schemes | Areas with active neighbourhood watch or community policing tend to feel safer | Check local council / police pages |
| Street lighting & footpaths | Even low-crime zones can feel unsafe at night if poorly lit | Visit at night to sense the environment |
| Type of dwelling (house vs flat) | Ground floors and back alleys tend to see more opportunistic crimes | Choose upper floors, secure entries |
| Amenity access (shops, transport, health) | Safety feels better when you don’t have to travel far for essentials | Check how services are distributed in the zone |
Sample safe-area shortlist & who it’s good for
- Family + green space priority: Richmond, Kingston, Sutton
- Good mix of calm + city access: Harrow, Wimbledon
- Central but safer: Hampstead, Notting Hill, parts of Chelsea
- Budget with safety in suburbs: Bexley, Bromley
All 32 of London’s boroughs ranked by safety score
| Borough | Population | Crime rate per 1,000 (YE Sep 2024) | Safety Score (0–10) |
| Richmond upon Thames | 198,019 | 59.91 | 10.0 |
| Sutton | 210,082 | 63.71 | 9.87 |
| Harrow | 250,149 | 64.33 | 9.85 |
| Kingston upon Thames | 182,120 | 66.22 | 9.79 |
| Merton | 229,406 | 66.93 | 9.77 |
| Bexley | 248,287 | 67.79 | 9.74 |
| Barnet | 389,344 | 71.89 | 9.6 |
| Bromley | 332,336 | 72.33 | 9.59 |
| Redbridge | 305,222 | 77.91 | 9.4 |
| Wandsworth | 327,506 | 79.77 | 9.34 |
| Havering | 257,800 | 80.45 | 9.31 |
| Enfield | 333,800 | 87.17 | 9.09 |
| Waltham Forest | 278,400 | 87.23 | 9.09 |
| Croydon | 390,700 | 91.21 | 8.95 |
| Ealing | 367,100 | 91.59 | 8.94 |
| Hillingdon | 314,890 | 92.45 | 8.91 |
| Barking and Dagenham | 218,900 | 93.79 | 8.87 |
| Brent | 340,000 | 96.44 | 8.78 |
| Greenwich | 289,100 | 96.66 | 8.77 |
| Lewisham | 303,500 | 97.24 | 8.75 |
| Hounslow | 270,782 | 98.59 | 8.71 |
| Haringey | 263,700 | 104.65 | 8.51 |
| Newham | 352,000 | 112.64 | 8.24 |
| Lambeth | 318,200 | 115.7 | 8.14 |
| Tower Hamlets | 310,300 | 116.12 | 8.12 |
| Hammersmith and Fulham | 185,000 | 116.65 | 8.11 |
| Hackney | 281,000 | 117.62 | 8.07 |
| Southwark | 330,500 | 120.44 | 7.98 |
| Islington | 239,100 | 122.05 | 7.92 |
| Kensington and Chelsea | 156,000 | 148.05 | 7.06 |
| Camden | 210,300 | 157.03 | 6.76 |
| Westminster | 270,800 | 359.34 | 0.0 |
Practical steps to assess a street before renting
- Use Police.uk “Compare your area” for trend and category context; then switch to ward-level or beat maps. Police.uk
- Check London Datastore for monthly borough counts by crime type; look for smoothing or seasonality. London Datastore
- Visit at different times (evening/weekend rush).
- Ask managing agents about building access control (fobs, CCTV, parcel rooms) and lighting on approaches.
- Speak with neighbours/shopkeepers for lived experience (noise, ASB, late-night activity).
How does a bourough saftey intersect with renting
- Lower-rise, secure-entry buildings and upper-floor apartments typically reduce opportunistic risks.
- Managed build-to-rent schemes often include fob access, staffed reception, and parcel handling—helpful for day-to-day peace of mind.
- Explore Essential Living homes and amenities across Islington, Greenwich, Bethnal Green and Maidenhead via the locations hub.
- Essential Living – Our Locations
- be sure to read through Cost of living blog , 10 Most Expensive Places to Buy Groceries in London and The Cheapest Places to Live in London in 2025to help with your moving journey.
For an overview of available apartments beyond these neighbourhoods, browse Homequarters.co.uk.
Method: what “safer” includes
- Crimes per 1,000 residents across total recorded crime.
- Trends versus the Metropolitan Police average over recent quarters.
- Composition (e.g., theft vs. violence/vehicle crime).
- Built environment signals: lighting, footfall, transport nodes (inferences informed by policing and planning literature).
- Official dashboards provide borough-level rates and category splits; drill down to wards when shortlisting homes.
How this ranking was built
This guide draws on official and near-term sources:
- Met Police/ONS “Compare your area” for per-1,000 crime rates and trends. Police.uk
- London Datastore (MPS Recorded Crime: Geographic Breakdown) for monthly borough counts by crime type. London Datastore
- Evening Standard (Jan 22, 2025) borough comparison based on Met Police Connect for 2024 per-1,000 figures. The Standard
- Time Out (Sep 17, 2025) for an independent safety round-up referencing Sutton’s strong showing. Time Out
FAQ's for safest areas in London
Which London borough has the lowest crime rate right now?
Richmond upon Thames recorded the lowest overall crime rate in 2024 at ~60.7 per 1,000 residents, followed by Kingston (~62.1) and Sutton (~62.9). The Standard
Are outer-London boroughs generally safer than inner ones?
Yes—per-capita rates skew lower in suburban boroughs, while high-footfall inner districts (e.g., Westminster, Camden) score higher. Always check ward-level data for the exact address. Police.uk
How do crime trends look in late-2024/2025?
Some low-crime boroughs show stable or falling trends quarter-on-quarter relative to the Met average; use Police.uk to compare quarterly trajectories by area and crime type. Police.uk
What types of crime drive differences between boroughs?
Theft (including shoplifting and pickpocketing) and violence-against-the-person categories account for much of the variation; tourism and night-time economy concentrate risk in central zones. The Standard
What’s the best way to evaluate one street vs. another?
Use Police.uk and the London Datastore for ward/LSOA detail, walk the route day and night, and review building security measures (secure entry, parcel rooms, CCTV). Police.uk


