
London is renowned for dividing opinion among the British population, with some insisting that the ‘Big Smoke’ is the best place on earth, and others branding it as too busy and expensive.
Every borough in the city has its own advantages and disadvantages, including parks, amenities, noise issues, and transportation options.
With all of this in mind, the team here at Essential Living has crunched the numbers to determine the best and the worst London boroughs to live in.
This was achieved by analysing eight important factors:
- The number of publicly accessible parks
- Percentage of accessible tube stations
- Percentage of cheaper supermarkets
- Distance to the centre
- Cost of travel to the centre by public transport and bus only
- Average house prices
- Percentage of noise complaints per borough population
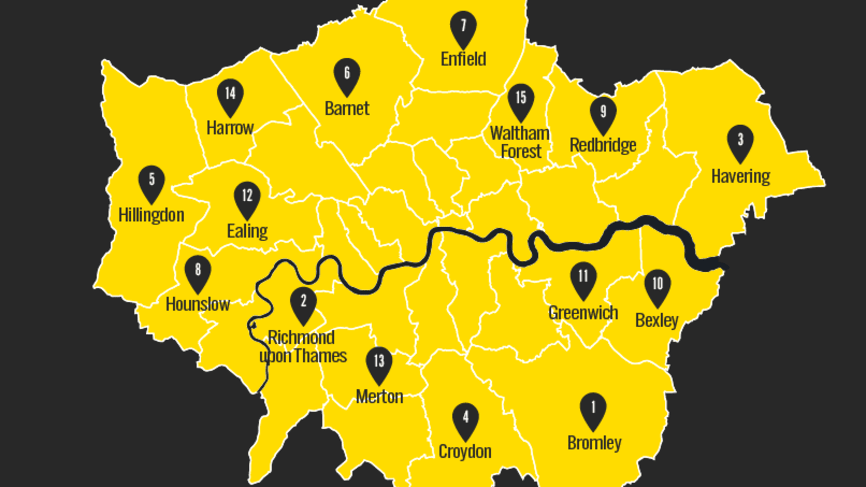
London is made up of 32 boroughs as well as the City of London. Inner London is made up of 12 boroughs while the remaining 20 make up outer London. Our study looked at all 32 boroughs, taking into account size as well.
Once the data was collated and each location had received an overall score out of 80, the London Borough Index was revealed.
Which are the best and worst London boroughs to live in overall?
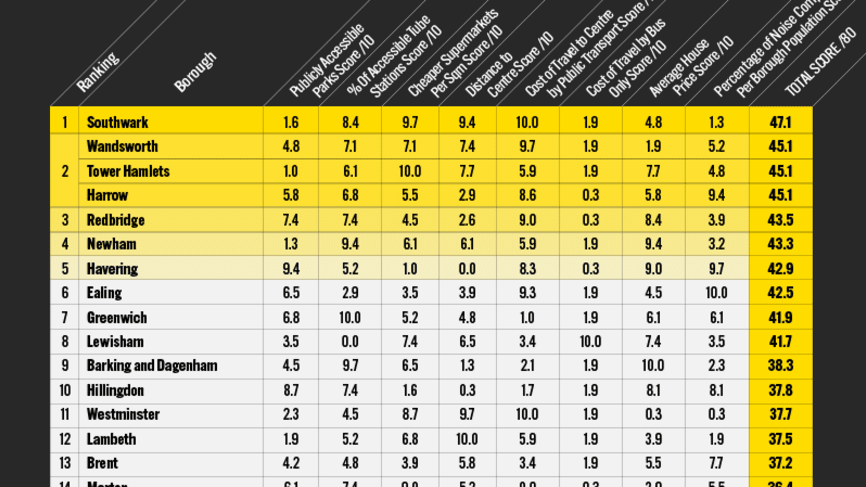
Our data shows Southwark is the best borough to live in London, with an overall score of 47.1 out of 80. It excels in public transport and affordability, scoring 10.0/10, and has 14 budget-friendly supermarkets, with a score of 9.7/10.
Wandsworth ranks second with a score of 45.1/80, achieving 9.7/10 for public transport affordability and 7.4/10 for distance to the city centre. It also scores 7.1/10 for accessibility to tube stations.
Tower Hamlets shares the second spot, also scoring 45.1/80. It offers affordable housing, with an average house price score of 7.7/10, and benefits from good public transport access and budget supermarkets.
Harrow rounds out the joint second place with a score of 45.1/80, known for its low noise complaints (9.4/10) and affordable travel (8.6/10).
In contrast, Kingston upon Thames is rated the worst borough to live in, with a score of 22.9/80, receiving 0.0/10 for accessible tube stations and low ratings for public transport affordability (0.7/10) and house prices (2.3/10).
Which of the London boroughs has the greenest space?
Next up, we analysed which of the London boroughs had the most accessible green spaces to explore, measuring in hectares (10,000 square metres).
In first place, with a maximum score of 10.0/10 was Bromley, boasting a staggering 2,585 hectares of green space. This would make the borough an ideal location for bringing up children or living with pets as there are numerous spots for walks and outdoor activities.
Richmond-Upon-Thames was next on the list, with an impressive score of 9.7/10. This was down to having 2,371 hectares of accessible green spaces, putting the borough very close to Bromley in this category.
Havering was in third place with an overall ranking of 9.4/10, due to 2,078 hectares of wide open spaces to enjoy. All of the top three locations had a very similar amount of greenery, revealing that London is surprisingly abundant when it comes to green belt land.
Islington ranked last with a score of 0.0 out of 10, largely because it only has 155 hectares of accessible green spaces. These scores were based on the Natural Capital Accounts for Public Green Space in London, assessing the suitability of each borough for families and outdoor enthusiasts.
Which London borough has the highest percentage of accessible tube stations?
Accessibility is vital for public transport, including wheelchair ramps and sufficient space on board.
Tube stations often involve many stairs, so it's crucial for people with disabilities to know which stations offer step-free access. We calculated the percentage of accessible tube stations in each borough.
It was revealed that Greenwich secured the title as the London borough with the highest percentage of accessible tube stations. Although the borough has only one tube station, this reflects its area of 18.28 square metres. So one tube station is accessible, meaning they scored an impressive 10.0/10.
Barking and Dagenham landed in second place, with three of the five tube stations in the area accessible, giving the location an accessible tube stations score of 9.7/10 and an accessibility percentage of 60.00%.
Finishing up the top three is Newham, with four of the seven tube stations easily accessible to disabled travellers. This gave the borough a score of 9.4/10 and a 57.14% rating for its accessible tube stations.
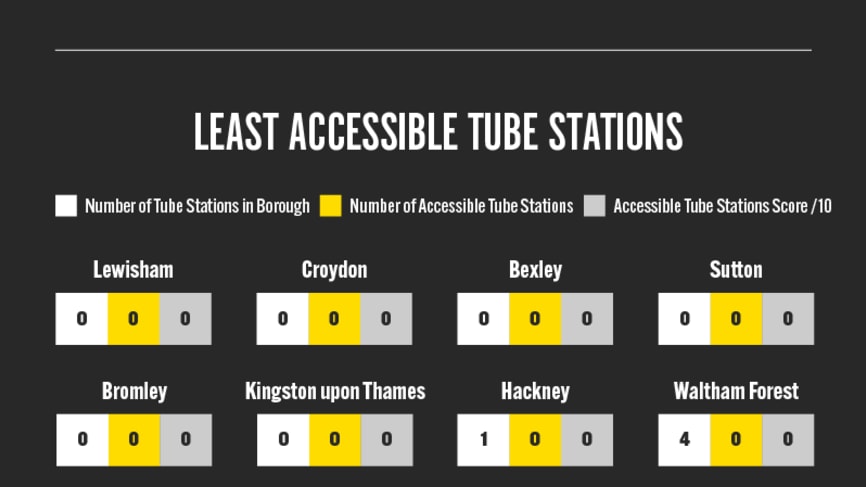
Many areas in the city have improved accessibility for disabled people, but several boroughs still lack accessible tube stations. Eight locations, including Lewisham, Hackney, Bexley, Sutton, Waltham Forest, Croydon, Bromley, and Kingston upon Thames, scored 0.0/10, indicating a significant need for more accessible stations.
Which London borough has the highest percentage of budget-friendly supermarkets in the area?
When relocating, consider nearby amenities – no one wants to drive far for groceries. We analysed boroughs based on the average number of Aldi, Lidl, and ASDA stores per square meter, ranking them on a scale of 10.
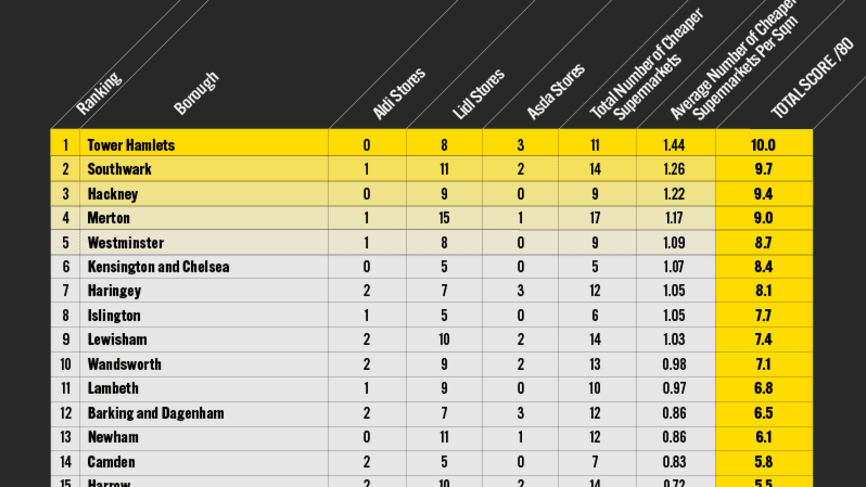
In first place was the borough of Tower Hamlets, with a winning score of 10.0/10, thanks to eight Lidl stores and three ASDA stores for shoppers to choose from. With 11 cheaper supermarkets in total, that means there are 1.44 cheaper supermarkets per square metre in this borough.
Southwark is crowned the second-best London borough to do a weekly shop on a budget, with a score of 9.7/10. The area has one Aldi store, eight Lidl stores and two ASDA supermarkets, meaning there are 1.26 bargain supermarkets for every square metre in this borough.
Shoppers looking to save on their food shop should pay Hackney a visit, as it ranks third with a score of 9.4/10. Unfortunately, there are no ASDA or Aldi stores in this borough, so shoppers will need to be fans of Lidl, which has an impressive nine locations! Overall, this equates to 1.22 cheaper supermarkets per square metre in Hackney.
Bromley is revealed as the worst place for an affordable food shop, with a disappointing score of 0.0/10. With a total area of 57.97 square metres, Bromley has only two cheaper supermarkets, equating to 0.03 cheaper supermarkets per square metre.
Which London borough has the most cost-effective and convenient travel options?
Next up, we crunched the numbers around the boroughs with the most convenient travel options. This took into account:
- The distance to the city centre in miles
- The cost to travel by public transport
- The cost of travelling by bus only.
This allowed us to give each borough a score out of 30 overall.
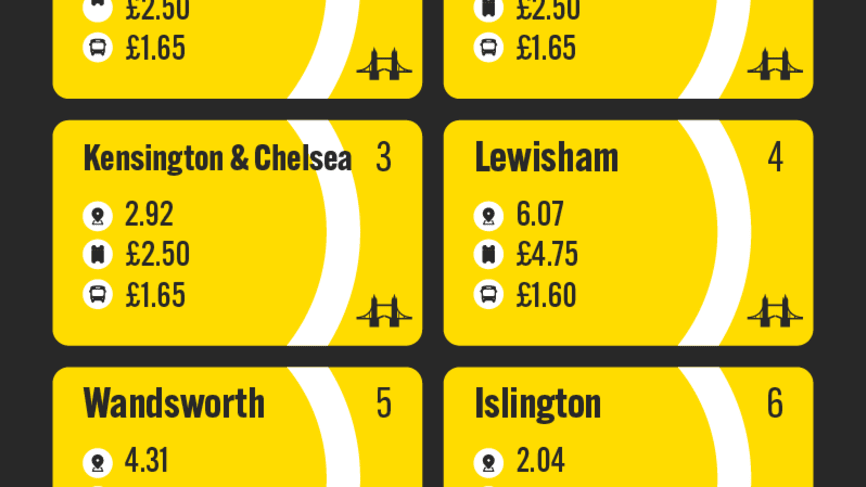
Westminster placed first, with an overall ranking of 21.6/30. This was achieved thanks to the borough being only a reasonable 1.1 miles from the city centre, allowing it to score 9.7/10 in the distance category. It also received a maximum score of 10.0/10 for the cost of travel to the city centre, with an average cost of £ 2.50.
Up in second place was Southwark, scoring 21.3/30 overall. This borough also had an average cost of £2.50 to get to the city centre, as well as an impressive score of 9.4/10 for its distance to the city centre (1.73 miles).
Despite scoring so highly in other areas, both boroughs in first and second place scored poorly on the cost of travelling to the city centre by bus, receiving only 1.9/10. This was due to the cost of getting to the centre by bus, which came in at £1.65 for such a short journey.
In last place was Bromley, which received only 3.1/10 overall. Its 12.85-mile distance from the centre of London has massively impacted this borough's overall score, with a measly 1.0/10 in this category alone.
Travelers from Bromley face a £5.05 public transport cost, contributing to a low overall score of 2.1/10 for the borough. Additionally, a £3.40 bus ticket to the city centre received a 0.0/10 rating for this section, which explains the poor score.
Which London borough has the cheapest and most expensive average house prices?
In order to determine which location had the best value-for-money house prices, we scoured Zoopla to find how many properties sold for on average in the last 12 months, including detached houses, semi-detached houses, terraced houses and flats.
In first place were Barking and Dagenham, with a maximum score of 10.0/10. The average house price in this borough was revealed to be £358,041, which is impressive given its proximity to the centre of London.
Bexley was in second place with a score of 9.7/10 - very close to stealing the top spot. This is due to the fact that houses in this borough cost, on average, around £439,467.
In third place was Newham, with another very impressive score of 9.4/10. We found that the average house price on Zoopla was £443,987 for this location, highlighting the great value for money that the average home in the top three boroughs provides.
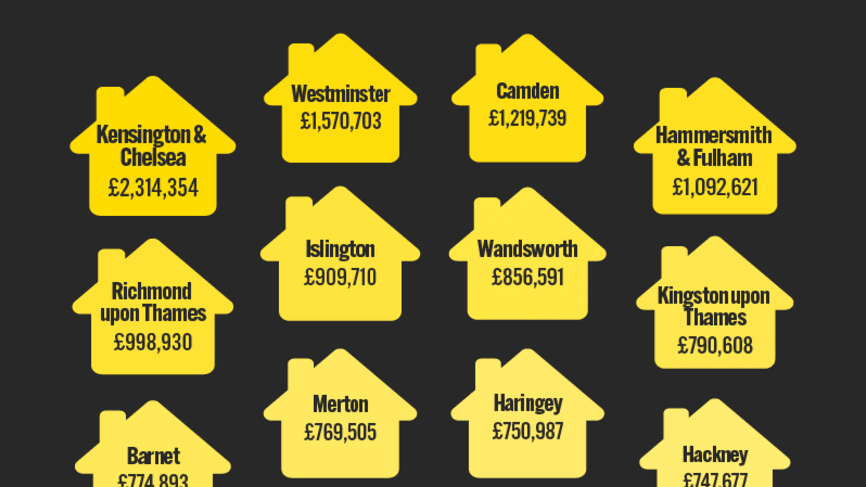
The average home in Kensington and Chelsea ranks as the most expensive, costing £2,314,354, which is no surprise given the borough's portrayal of wealth in the reality show ‘Made in Chelsea.’
The second most expensive houses were in the London borough of Westminster with a disappointingly low score of 0.3/10. Having Buckingham Palace on your doorstep doesn’t come cheap, with houses in the area costing a whopping £1,570,703.
Emerging as the third most expensive borough of London to lay down roots is Camden with an unappealing score of 0.6/10. The bustling area known for its popular Camden Market, boasting an extensive range of shops, stalls, bars and eateries comes with a hefty price tag for houses at £1,219,739.
Which London borough has the most and least noise complaints?
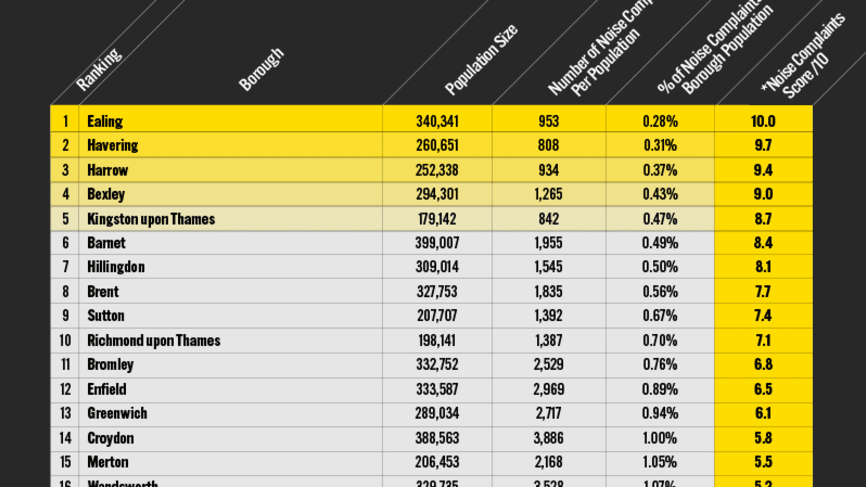
Finally, we looked into the boroughs that had the least amount of noise complaints - and the unlucky ones that had the most. In first place was the quiet, tranquil borough of Ealing, which was discovered to have 953 noise complaints per population size (340,341). This gave it an overall score of 10/10 with just 0.28% of complaints per borough population.
In second place was Havering, which achieved a ranking of 9.7/10. This exceptionally high score was due to 808 noise complaints per population size of 260,651, which works out at 0.31%. Up in third was Harrow with 934 complaints, which works out at 0.37% of the population of 252,338. This gave the location an impressive 9.4/10 overall.
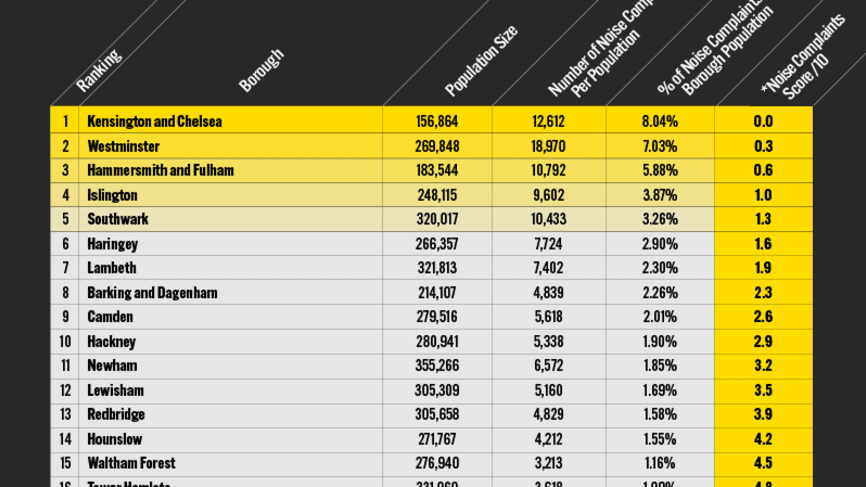
Kensington and Chelsea fell into last place once again, with a total score of 0.0/10. The population of 156,864 has 12,612 average noise complaints, which works out at a worrying 8.04% per population size - possibly due to raucous ‘Made in Chelsea’ parties.
Methodology:
Overall ranking - We identified which London Borough would be the best to live in by analysing eight factors. These factors were the number of publicly accessible parks, the percentage of accessible tube stations, the percentage of cheaper supermarkets, distance to the centre, the cost of travel to the centre by public transport and by bus only, average house prices, and the percentage of noise complaints per borough population.
The most green space - We analysed the amount of green space in hectares of each London borough's publicly accessible park. We then scored the boroughs out of 10 overall and ranked them.
Percentage of accessible tube stations - We counted the number of tube stations in each borough and calculated the percentage that were accessible. We then scored the borough's percentages out of 10 and ranked them.
Cheaper Supermarket Stores - These were selected from a seed list (https://www.goodto.com/money/cheapest-supermarkets-657819) that listed the top three cheapest supermarkets. We then used store locators to determine how many stores were in each borough and calculated the number of stores per square meter in each borough.
Travelling to the city centre - The distance was calculated using Google Maps’ ‘measure distance’ tool. For the cost of travelling to the city centre, we used the TFL Journey Planner and filtered the search results to include travel by Bus, National Rail, London Overground, Tube, DLR, and the Elizabeth Line. We also made sure these searches were for journeys on Wednesday, 30th November 2022 at 10 am across all Boroughs.
Average House Prices - This is the average selling price of detached houses, semi-detached houses, terraced houses and flats within the London Boroughs in the past 12 months.
Percentage of noise complaints - We used the number of noise complaints per 1,000 residents and calculated the percentage of the Borough population.
Sources:
Good To Know | TFL | Asda | Aldi | Lidl | Wikipedia | Go Parks | Brent Youth Zone | Bromley Parks | Camden Gov | Feraa | Visit Greenwich | Hackney | Haringey | Harrow Gov | Hillingdon Gov | The Royal Borough of Kensington and Chelsea Gov | The Royal Borough of Kingston Upon Thames Gov | Lewisham Glendale Local | Merton Gov | Newham Gov | Redbridge Gov | Sutton Gov | Tower Hamlets | Waltham Forest Gov | Wandsworth Gov | Westminster Gov | Transport For All | All In London | Google Maps | Zoopla | LG Inform | Statista | London Gov | Wikipedia | My London


